That’s why it’s important for you to be able to have a rudimentary understanding of data and data visualization. We call this basic understanding data literacy. Basic data literacy begins with an understanding of how to use the most common charts. Once you know the best practices of data visualization, you will be able to recognize a good dataviz from a bad one. Here are the quick and dirty tips for how to use the four basic chart types you will come across: pie charts, vertical bar charts, horizontal bar charts, and line charts.
1. Pie chart
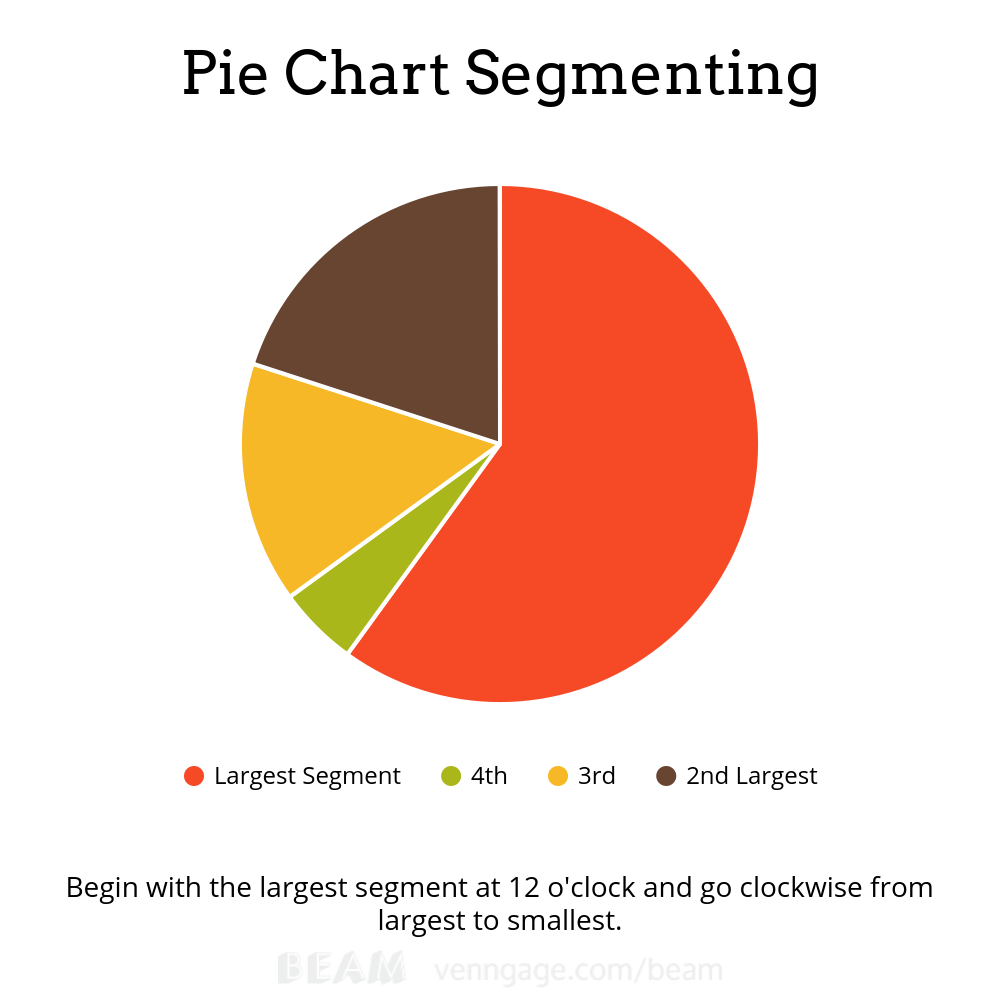
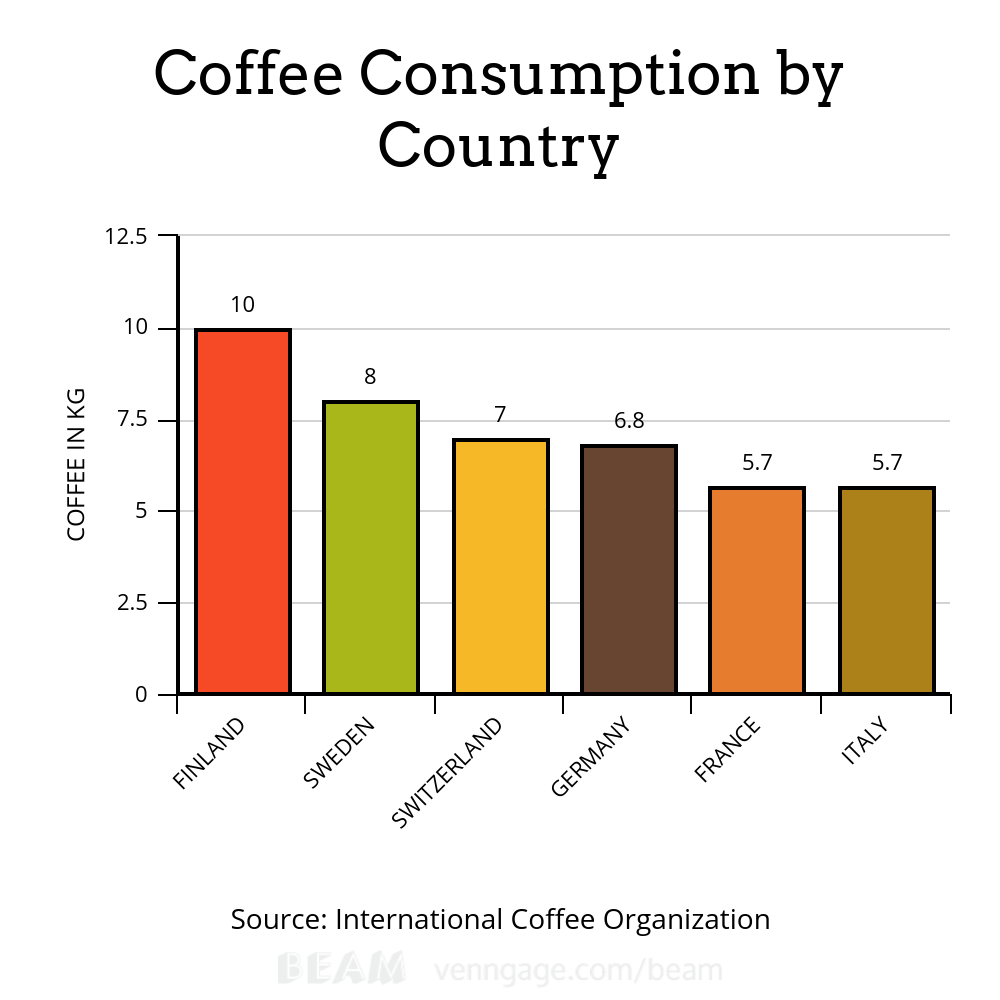
Make a pie chart when you want to show parts of a whole. Don’t use them when you want to show complicated relationships between many segments. This means that their use is more limited than other charts, but people love pie charts so you’ll still probably want to use them often. Use vertical bar charts to demonstrate discrete quantities (quantities divided into units, like numbers, as opposed to continuous quantities, like duration).
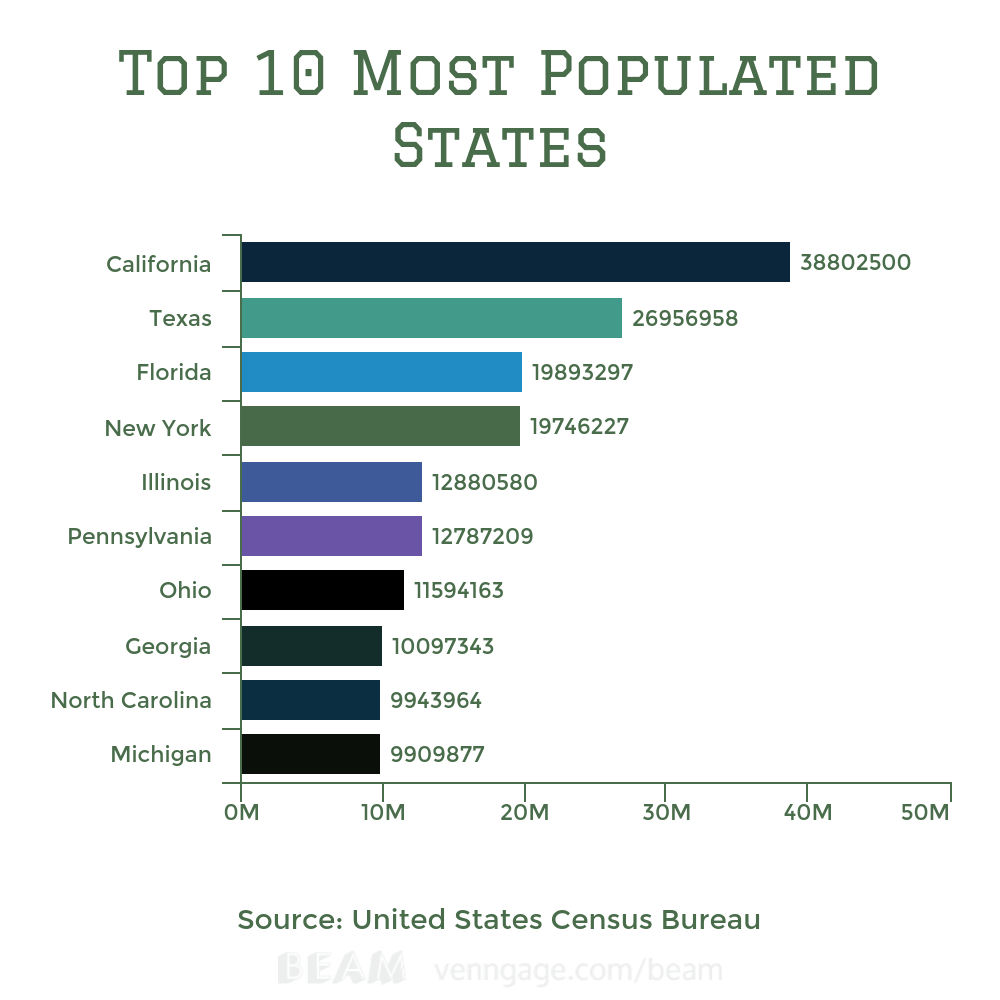
3. Horizontal bar charts
These are basically vertical bar charts that are lying down. This kind of chart is particularly useful for ranking items by the same attributes, with the longest bar at the top of the chart and the descending to the shortest.
4. Line charts
Line charts are great for showing data over a period of time.